Prototype Testing Result
The prototype was able to let us undergo testing after initial troubleshooting. With the spectrometer attached directly to the platform, it became more difficult to know if the spectrometer was focused well and to adjust it since the view of the chip is obstructed by the translator. Calculations were made to adjust the focus of the lens, but the varying compression of the PDMS layer from tester to tester meant that the focus was not perfect. An adjustable lens barrel was bought to facilitate easier focusing of the lens. In addition, the optimum compliance of PDMS was found via testing different mixing ratios of PDMS base to curing agent. However, a commonality among all PDMS layers was that they leave residue on the porous silicon chips. As PDMS does not have a direct solvent, an inert coating must be determined before prolonged use of PDMS layers. However other aspects of the prototype such as its overall build quality and the temperature control base worked well during testing.
Validation Testing
The following tests were conducted to validate the improvement of the biosensor platform in regards to the sources of noise identified in preliminary testing.
Eliminating Bubble Disruption
The appearance of bubbles in the flow cell usually meant that the any data after the entrance of the bubble would be unusable data. Bubbles were purposely introduced into the flow to measure and see their effects. In the original design, the bubble stays inside the flow chamber (Figure 1A), obstructing the reading of the spectrometer. The new orientation and flow chamber shape allows the bubble to flow as a plug up and out (Figure 1B), only slightly disrupting the data before returning to normal.
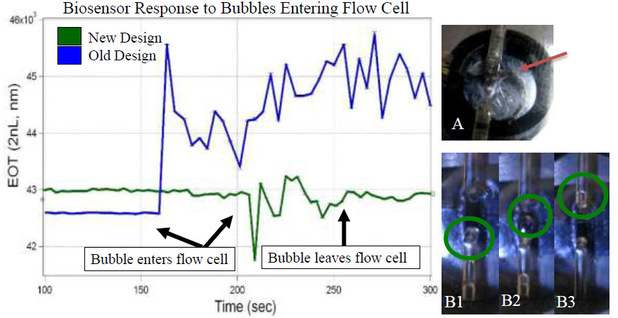
Figure 1. The new design allows bubbles to pass through and reacquire data, whereas the old design does not.
Reducing Ambient Light Effect
Attaching the spectrometer directly to the biosensor platform decreased the change in EOT when the ambient light changed. The biosensor was run to reach initial steady state values and then the lab lights were turned off, the original design experienced a change of -16nm, while the new design only experienced a shift of -5nm.
Attaching the spectrometer directly to the biosensor platform decreased the change in EOT when the ambient light changed. The biosensor was run to reach initial steady state values and then the lab lights were turned off, the original design experienced a change of -16nm, while the new design only experienced a shift of -5nm.
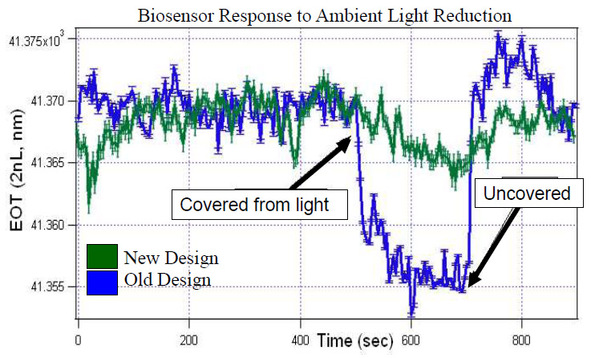
Figure 2. The new design experiences minimal change in EOT reading when ambient light is changed compared to the old design.
Minimizing Temperature Fluctuation
Temperature of the biosensor chips in both old design and new design were monitored over a three span of three days. The room temperature fluctuation caused these temperatures to vary over time. The maximum temperature fluctuation of the old design was 1C, whereas it was 0.5C for the new design. At an EOT of 40,000nm, these fluctuations corresponded to a 2.3 nm and 1.2 nm drift in the signals of the old design and new design respectively.
Temperature of the biosensor chips in both old design and new design were monitored over a three span of three days. The room temperature fluctuation caused these temperatures to vary over time. The maximum temperature fluctuation of the old design was 1C, whereas it was 0.5C for the new design. At an EOT of 40,000nm, these fluctuations corresponded to a 2.3 nm and 1.2 nm drift in the signals of the old design and new design respectively.
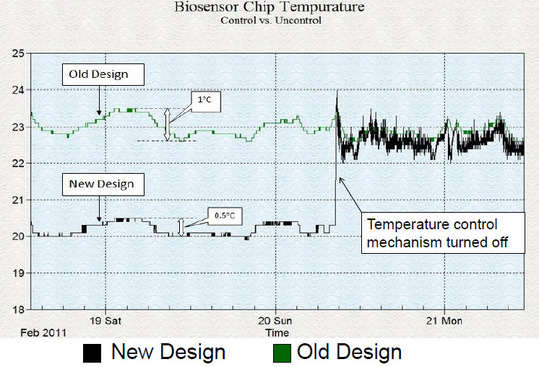
Figure 3. Biosensor chip temperature in old and new design.
Optimizing Mixing Efficiency
Mixing efficiency testing tries to quantify the response time and uniformity of data obtained from both flow cells. The test was split into two separate parts: a qualitative assessment of flow properties, and a quantitative assessment of response time.
--Qualitative Testing
This test analyses flow properties within the chamber of each flow cell by introducing rhodamine dye. The dye fluoresces under UV light, so a camera was used to record the chamber as the dye was introduced, as shown below. Figure 4 shows the new flow chamber (B) has much more uniform flow properties at the same time point as the previous design (A).
Each flow cell was recorded while being introduced to a rhodamine dye plug under UV light. The new flow cell (left) shows faster and more uniform flow properties than its predecessor (right).
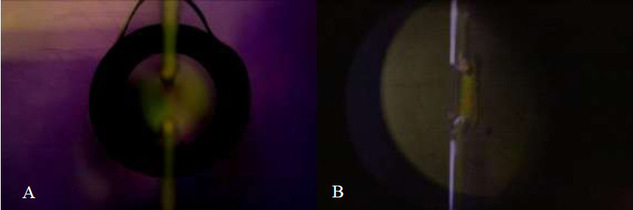
Figure 4. Flow properties in old flow cell (A) compared to new flow cell (B) at the same time point after rhodamine introduction to chamber.
The test shows that the original flow cell takes longer to reach equilibrium (where there is no visible difference frame data) than the new cell by 5.5 seconds as determined by frame data. More importantly, the prototype flow cell has more linear flow properties; while the old flow cell shows the existence of eddies and stagnant flow, the new design uniformly reaches equilibrium.
--Quantitative Testing
This test ran identical quantities of sucrose in both flow cells to determine the difference in noise level and time to equilibrium values. The results of this test are shown in Figure 5.
--Quantitative Testing
This test ran identical quantities of sucrose in both flow cells to determine the difference in noise level and time to equilibrium values. The results of this test are shown in Figure 5.
Biosensor Response Times: New Design vs. Old Design
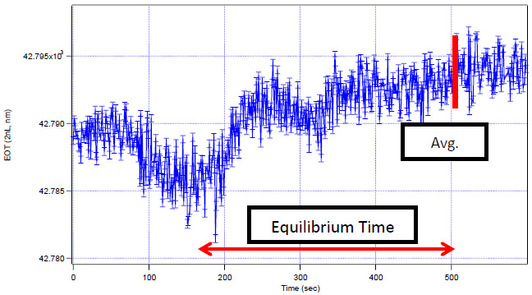
Figure 5a. Prototype flow cell spectrometer reading of 5mg/ml surcrose in phosphate citrate buffer. Flow rate set to 14 μl/sec.
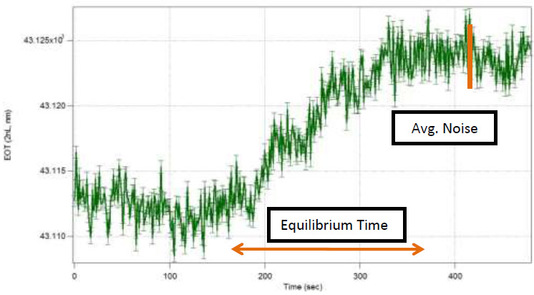
Figure 5b. Original flow cell spectrometer reading of 5 mg/ml sucrose in phosphate citrate buffer. Flow rate set to 14 μl/sec.
Results of this test show that the original flow cell exhibits same noise level (±2.5 nm), and also less time to equilibrium than the new design. However this round of testing was completed using a biosensing chip that had PDMS residue. This residue is not negligible and could be causing reagents to become permanently lodged in pores. While these test results do give an idea of the response times, the current noise levels are higher than the noise levels other researchers in the Sailor Lab generate. Additional testing will be attempted once resources for additional chips are available.
Discussion of Testing
Validation testing has shown that while our prototype needs many improvements, it still was able to meet some of the design goals we set to meet. The device cost around $1000 due to the low cost of machined parts, which will also decrease further when the prototype design is finalized and replaces the currently used design. It also has a setup time that in on par with the old flow cell; around 5 mins are needed to begin flowing solution. Temperature affects refractive index of fluid moving through the flow cell. Hence, temperature fluctuation causes EOT signal to drift. The incorporation of an active temperature control mechanism helps stabilizing the temperature fluctuation of the biosensor chip. Thus, this helps reducing the signal drifting caused by ambient temperature fluctuation by 50% in the new flow cell. The vertical orientation in combination with the chamber shape completely removes bubbles from the chamber. This makes our device much easier to use once testing begins, and doesn't risk data. However, we have yet to show that the prototype meets our most important design goal of decreased noise level <2nm. We were also unable to do any statistical analysis with our testing as we ran out of raw materials for chips to take more data. Once we receive materials for additional chips, more testing can be done to determine the difference in noise level statistically between the original and prototype flow cell. The planned analysis was to do 10 identical baseline runs of an identical solution through both flow cells, and then analyze each spectrometer reading for an average value and average noise level. These would then be compared using a paired t-test to determine if there was a significant difference in populations. However known factors such as incorrect acrylic, PDMS residue on chips, and poor focal length control need to be addressed before our design should be able to produce better data than its predecessor. Yet the validation testing has shown that the new design has improved by reducing the lasting effects of bubble on the ability to take data, reducing EOT shifts due to ambient light disruptions, creates more uniform flow properties, and is buffered against temperature change.
Strengths and Weaknesses
Our design builds upon the existing flow cell design, without taking any risks into safety, and even aims to make the system easier to use, all while obtaining more accurate results. The only safety risks are when using hazardous chemicals, and the redesign also aims to minimize leaks through use of ferrules and nuts for tubing connections. The system has methods to improve on the existing design in all design goal objectives.
The main drawback to our redesign is the increase in cost. Many new parts need to be fabricated, and ordered. Also the addition of the PDMS layer adds another component to the setup of the flow cell, and needs soft lithography depending on the chemical or protein being tested. However, the additions to
cost are inherent with making a higher sensitivity system. The important factor is the cost to sensitivity ratio, or the gain in sensitivity for the cost of system. If this factor is low for our redesign, the usefulness of the redesign is greatly diminished.
In its current state, the prototype needs a few adjustment parts to address problems found via testing. The ability to focus the spectrometer without visibility of the chamber is important for high sensitivity readings, and therefore needs to be address before we can our prototype can compete on par with the old flow cell. Also, PDMS residue on chips greatly decreases the cells usability as it will use up chips at a much faster rate. Before the prototype can be adopted a suitable coating needs to be found.
-Sid Kundu, Vivian Le, Alex Phan
